Tip: Start typing in the input box for immediate search results.Can't find what you're looking for? Submit a support request here.
Graph Overview
Introduction
StressCheck provides an integrated graphing function for viewing computed data. A graph pane of computed data is automatically produced by all Results output classes except Plot Solution. A graph pane may also be displayed to illustrate nonlinear material properties and nonlinear radiation boundary condition coefficients. The graph pane is automatically formatted for each type of data, but it is sometimes desirable to change the format from the default (as described in the following).
Default Graph Appearance
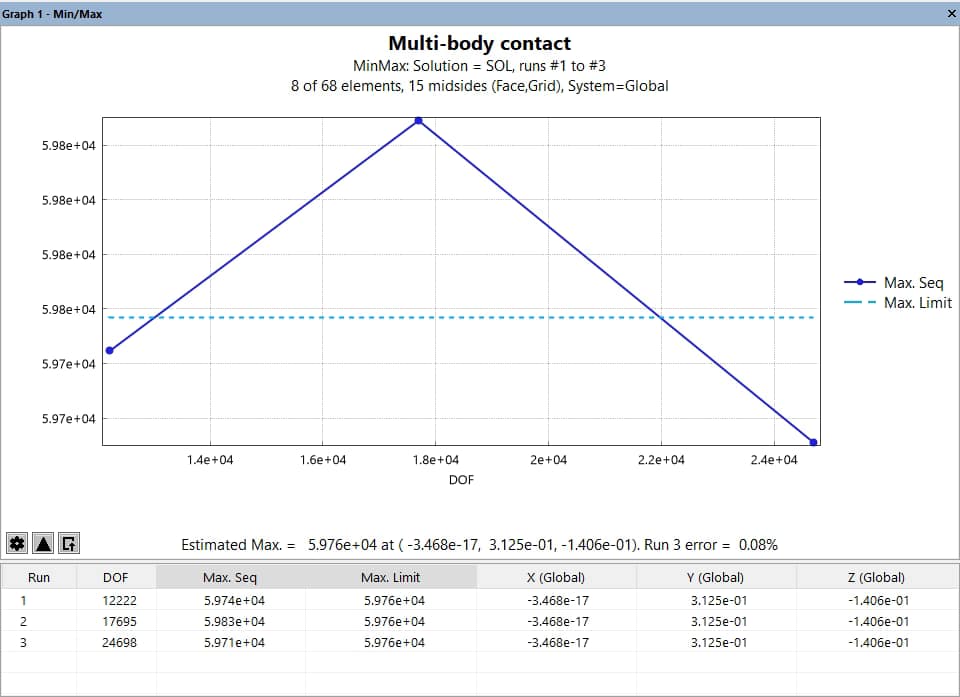
The following is an example of a graph pane produced after a Min/Max extraction (Figure 1):

The Graph pane is divided into two distinct regions:
- Plot Area (top): Displays plotted results using lines and/or markers.
- Table Area (bottom): Presents tabulated data corresponding to the plot.
By default, the plot area uses a white background with light gray gridlines and plots data using connected straight lines. The appearance and behavior of both areas can be customized using the Graph Configuration and Axis Options tools.
Graph Customization Tools
Graph Configuration (Gear icon  )
)

Clicking the gear icon opens the Graph Configuration dialog (Figure 2), which allows customization of:
- Grid Settings: Control line style (Solid, Dash, Dot, or None) and color for both major and minor gridlines.
- Legend: Set display location (Right, Top, or None).
- Fonts: Independently define fonts for the graph title, axis labels, headers/footers, and legend.
- X/Y Format: Specify numeric display format using standard C-language format specifiers (default: %1.3g).
- Lines and Markers: Toggle the display of plot lines and markers.
- Dependent Variables Table: Customize each plotted variable’s line type, color, width, marker style, size, and fill.
- Settings Management: Save/load graph configuration using .scgs files or reset to defaults.
Each graph type (e.g., Error, Points, Min/Max) can maintain its own set of configuration settings.
Axis Options (Triangle icon  )
)

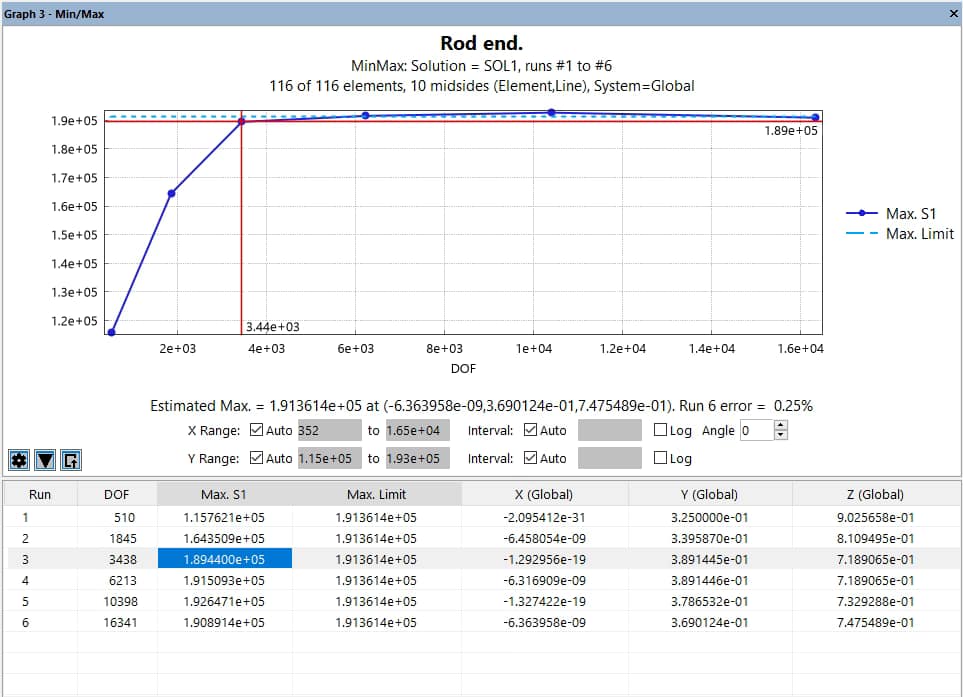
Clicking the triangle icon reveals controls for adjusting axis scaling and layout (Figure 3):
- X and Y Range: Automatically determined or manually specified.
- X and Y Interval: Automatically determined or manually defined grid spacing.
- Logarithmic Scales: Enable base-10 logarithmic scaling for X or Y axes.
- Label Angle: Adjust the rotation of X-axis labels (default: 0°).
Click the triangle icon again to hide the axis options panel.
A Note on Graphing Large Data Sets
When the number of data points plotted exceeds the pixel width of the graph, StressCheck automatically switches from rendering individual points to displaying averaged data. This behavior helps maintain performance and readability, especially during point extractions involving multiple selected elements.
- If the Independent (X-axis) Variable is “N”, “Element #”, or “DOF” then StressCheck disables point rendering and displays the following message: “Number of points exceeds pixel resolution, displaying an average line.”
- If the Independent (X-axis) Variable is something else (e.g., “X”) then a different averaging algorithm is applied, and the message shown is: “Number of points exceeds pixel resolution, displaying averaged data.”
A Note On Auto Range Behavior for Extremely Small Data Values
In cases where the data range is extremely small (i.e., values less than 1e-7 units), StressCheck may automatically disable the “Auto” range checkbox in graph settings. This precaution helps prevent unexpected or improper graphing behavior that can occur when plotting such narrow value ranges.
Table Area Features
The table area displays numerical data in rows and columns. Each column corresponds to a variable (e.g., DOF, S1 max, X location), while each row represents a data point (e.g., extraction number).
Key table area functions include:
- Assign Variables: Left-click a column header to select it as the Independent (X-axis) or Dependent (Y-axis) variable.
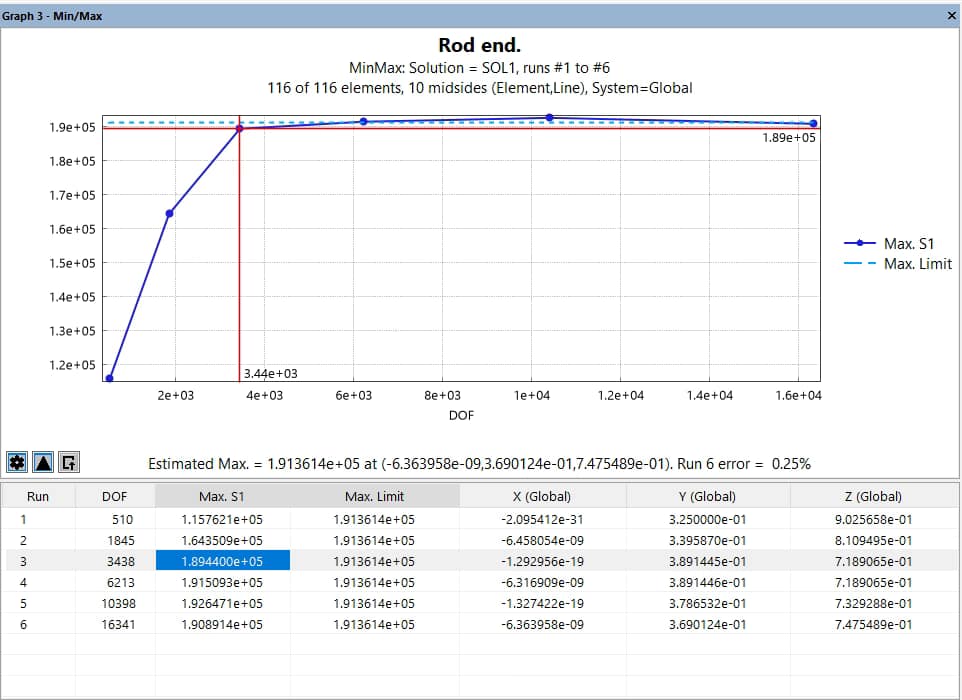
- Highlighting: Selecting a row displays intersecting red guide lines in the plot for the corresponding X and Y values.
- Copying Data: Right-click the table area and select Copy grid to clipboard to paste into Excel or other applications.
- Font Customization: Right-click a column header and choose Select Table Font… to modify the display font.
Figure 4 demonstrates the corresponding red guide lines in the plot area for a selected table row:

Exporting Graph Images
To export an image of the current plot:
- Click the Export icon
located in the bottom-left corner of the plot area.
- Choose between:
- Use current window size (Width x Height)
- Specify image size… (input dimensions in pixels)
- Select the desired image format:
- PNG, JPEG, GIF, BMP, or TIFF
The following demonstrates how the independent variable can be modified from Run # to DOF:
 Serving the Numerical Simulation community since 1989
