Tip: Start typing in the input box for immediate search results.Can't find what you're looking for? Submit a support request here.
Display Menu Overview
Introduction
There are several ways to manipulate the contents and appearance of the graphic display information for a model. These options are contained in the Display pulldown menu in the Main Menu Bar, in the Display Objects pane (Display > Display Objects), in the Cutting Planes pane (Display > Cutting Planes), and in the Display Controls pane (Display > Display Controls).
Reset
Redraw the Model View display area. Selecting Display > Reset will ensure the rendering of model data is refreshed and model display attributes are re-scaled to the current view. Alternatively, the user may click the Display Reset icon on the Edit Toolbar: .
Model Manipulation
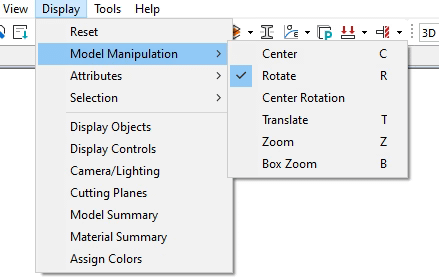
You may change the orientation of the model on the screen by translating, zooming, or rotating (Figure 1). Model orientation may be manipulated dynamically using the mouse cursor. First you must choose the type of orientation operation you wish to perform by selecting Display > Model Manipulation in the main menu or clicking the appropriate icon in the Views Toolbar.
Translation (T hotkey), Rotation (R hotkey), and Zoom (Z hotkey) are self-explanatory. Just hold the right mouse button + drag the mouse while you hold down the button. The Box Zoom option (B hotkey) is provided so that you may draw a rectangle (box) around the area of interest and it will be expanded to fill the Model View display area.
Additionally, it is possible to use a point object as the model center of rotation (Center Rotation). Simply right click near the point of reference, and the center of rotation will automatically be set to this point.
A complete description of Model Manipulation options, as well as navigation cube features and convenient hot keys/function keys, is given in the Dynamic Display Operations Overview.
Attributes
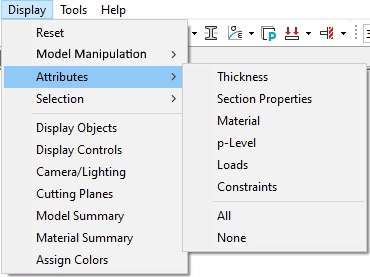
The Display > Attributes menu (Figure 2) contains options for displaying various model attributes in the graphic display area such as loads or constraints, etc.
To control scaling of the attribute symbols, you must interact directly with the corresponding property sheet class tab of the Input dialog.
A complete description is given in the Attributes Toolbar Overview.
Selection
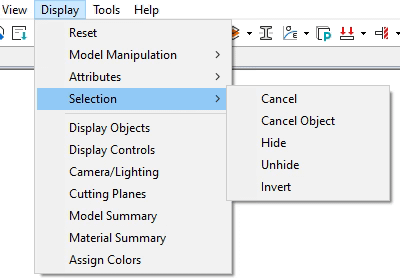
The Display > Selection menu (Figure 3) provides a mechanism for controlling the display of selected or hidden objects.
You may cancel the current object selection (Cancel), cancel the current object selection by specific object type (Cancel Object), hide the current object selection (Hide, CTRL+O hotkey combination), show the currently hidden objects (Unhide, CTRL+U hotkey combination) or invert the current object selection (Invert, CTRL+I hotkey combination).
Note: since objects highlighted for selection will paint over any other objects occupying the same space (for example, a selected element face will paint over its associated element edges), it is recommended to enable the Select Through toggle before initiating the selection process for coincident objects.
A complete description of Selection options is given in the Edit Toolbar Overview.
Display Objects
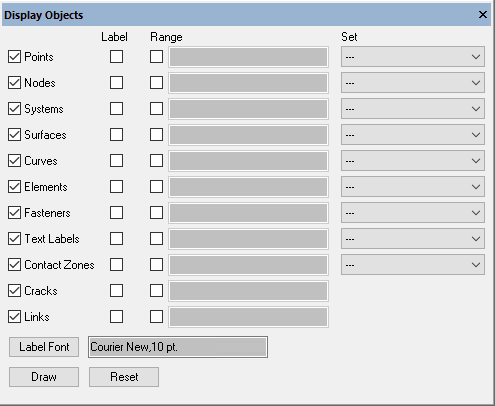
The Display > Display Objects pane (Figure 4) provides a mechanism for controlling the display, labeling, range and set filtering for each object type (Nodes, Elements, Surfaces, Curves, etc.).
- The first column contains check boxes to enable the display of specific object types.
- By default, all object types are enabled for display.
- Checking the box next to a specific object type, and then clicking the Draw button, will update the display to include that object type. This action is mirrored by the button status on the Display Objects toolbar.
- Conversely, unchecking the box next to a specific object type, and then clicking the Draw button, will suppress that object type from the display.
- The Label column contains check boxes to enable/disable the display of numbering labels for specific object types. Since each object in StressCheck is assigned a unique object number, it can be used to obtain this feedback for investigative purposes (e.g., when receiving a warning or error with an object label).
- The associated object type must be currently displayed to enable its Label check box.
- By default, all Label check boxes are disabled.
- Once a Label check box has been enabled/disabled, clicking the Draw button will update the display of object labels.
- For example, the labels for nodes 111, 112, 121, 124 would appear as follows:
- The Range column contains check boxes to enable/disable the range input field for specific object types. Once enabled, the user may enter one or more ranges to filter the display of that object type.
- The associated object type must be currently displayed to enable its Range check box.
- Range inputs may be separated by commas (e.g., 1,3,5-12).
- For example, a range of node numbers including 50-60, 100-125, and 300-326 may be entered in the corresponding “Node” range box as follows:
- Once a valid range has been entered, clicking the Draw button will update the object range(s) displayed.
- To reset the range fields, click the Reset button.
- The Set column contains combo boxes to allow the user to display a specific set of objects. Object sets may be manually defined via the Input dialog, Sets class, or automatically generated by StressCheck when defining input records via user selection of objects (e.g., selecting elements for material assignment).
- The associated object type must be currently displayed to enable its Set combo box.
- By default, each Set combo box will display “…” indicating that no set name has been specified for display/filtering.
- Once a set name has been selected from the Set combo box, clicking the Draw button will update the display to show only objects belonging to that specific set name.
- To return the display of all objects for the associated object type, select “…” from the Set combo box and click the Draw button.
- The Label Font button will display the Font dialog and permit the user to change the font used for object labels.
Display Controls
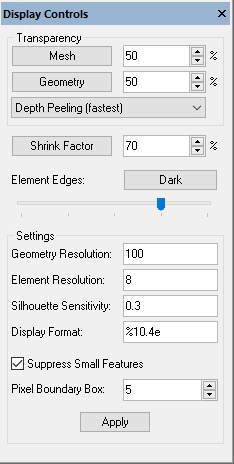
Model manipulation, visualization, display format and rendering preferences may be controlled by selecting Display > Display Controls (Figure 5).
- Within the Display Controls dialog, you may control the transparency of mesh and geometry objects (Transparency buttons and fields), and the shrink option for the elements (Shrink Factor button and field).
- It is possible to display the finite elements transparently by picking the Mesh button.
- It is possible to display geometric surfaces transparently by picking the Geometry button.
- Choose the degree of transparency by entering a value from 0 to 100 in the input field, or by clicking the spinner arrows next to the input field.
- A value of zero (0) represents complete opacity.
- A value of 100 represents complete transparency.
- There are three (3) transparency rendering options:
- Depth Peeling (default) is a very fast rendering method, but loses accuracy with low transparency settings and when there are multiple layers of transparent objects behind each other.
- Fast Z-sort uses a more approximate method of sorting transparent faces, a compromise between speed and accuracy.
- Accurate Z-sort is the method always used in previous StressCheck versions, offering the most accurate transparency rendering at the cost of lower frame rates when changing the camera position.
- Element edge rendering (Element Edges) may be toggled between Dark (black element boundaries, default) or Light (white element boundaries), with a slider controlling the element edge opacity.
- The resolution of geometric boundary objects (Geometry Resolution field, Range is 5 to 150, Default=100) and element edges (Element Resolution field, Range is 0 to 20, Default=8) may also be increased to improve display precision, or decreased to improve display speed.
- Note on Element Resolution: the Element Resolution field in the Display Controls dialog and the Elem. Res. field in the Plot tab of Results are synchronized. In addition, when loading a model containing more than 150,000 elements and the Element Resolution is greater than 4, the resolution is automatically reduced to 3. This adjustment improves performance by enabling faster model loading and initial static mesh generation.
- Note on Face Displacement: When edges (or curves) are coincident, or very nearly coincident with faces (or surfaces), the edges can be visually obscured by the coincident faces. In order to reduce this effect, faces are displaced slightly away from the direction of the point of view so that the edges will appear slightly in front of a coincident surface.
- However, in the case of very thin domains, where there are two surfaces which are themselves nearly coincident, the displaced location of the faces may be such that the edges which should be hidden from view will appear to bleed through and become visible in front of the front surface. When this occurs, it may be desirable to reduce the amount of face displacement.
- By decreasing the value for Face Displacement in the Display Controls dialog, this “bleeding” effect can be reduced.
- The consequence is that edges which are in fact coincident with a surface may not be as visible in the general case.
- When the Element Silhouette toggle is enabled from the Display Options toolbar, the Silhouette Sensitivity controls the amount of silhouette outlining on the element boundaries (Range is 0.1 to 20, Default=0.3).
- A Silhouette Sensitivity value of 0.1 applies the maximum silhouette outlining effect.
- A Silhouette Sensitivity value of 20 applies the minimum silhouette outlining effect.
- The Display Format controls the precision of the data values displayed in the Geometry Input box and the Input Check reports. This is a C language format specification.
- The Display Format accepts %f, %e, and %g specifiers.
- %f = Display the floating point number using decimal representation.
- %e = Display the floating point number using scientific notation with e.
- %g = Use shorter of the two representations: f or e.
- The Display Format precision is defined by “.number”, where number controls the number of digits printed after the decimal point.
- For example, using “%.3f” would represent “3.14159” as “3.142”.
- Currently, the default Display Format when StressCheck is started is “%10.4e”. The default display format may be changed temporarily for the current session, or permanently for future sessions.
- The Display Format of the current session will be stored with the StressCheck workfile or project when saved.
- When the StressCheck workfile or project is opened in StressCheck, the display format at the time of save will be recovered.
- The Display Format may be permanently modified under File > Options.
- Modifying the default Display Format, then clicking Accept, will result in this being the new default display format for all new sessions.
- The Display Format accepts %f, %e, and %g specifiers.
- When the Suppress Small Features check box is enabled during dynamic model rotation, StressCheck will not render objects which can be contained in a volume of size defined by the Pixel Boundary Box.
- To apply any changes made to the Display Controls pane, click the Apply button.
Camera/Lighting
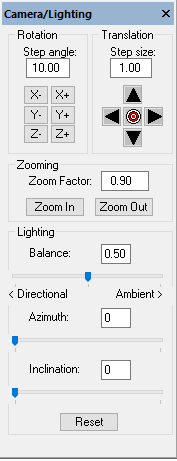
The Camera/Lighting dialog contains input fields for controlling the size of each dynamic display rotation step, translation step, and zoom factor, as well as lighting controls.
- The Rotation options allow the user to to incrementally rotate the current model view about the global coordinate system axes.
- Each click of the X-, X+, Y-, Y+, Z- or Z+ button will result in the model incrementally rotating about that global axis by the specified Step angle (in degrees, Default = 10 degrees).
- The user may change the Step angle to increase/decrease the rotation increment.
- The Translation options allow the user to to incrementally translate the current model view in the vertical and horizontal directions.
- Each click of the up, down, left or right button will result in the model incrementally translating in that direction by the specified Step size (in length units, Default = 1 length unit).
- Clicking the center “bullseye” button will result in the centering of the current model view.
- The user may change the Step size to increase/decrease the translation increment.
- The Zooming options allow the user to to incrementally zoom in or out on the current model view.
- Each click of the Zoom In or Zoom Out button will result in the model incrementally zooming in or out, respectively, by the specified Zoom Factor (Default = 0.9, Valid Range = [0,1.0]).
- A Zoom Factor close to 1.0 means each button click will result in a smaller zoom transition, while a Zoom Factor close to 0 will have the opposite result.
- The user may change the Zoom Factor to increase/decrease the zoom effect.
- Each click of the Zoom In or Zoom Out button will result in the model incrementally zooming in or out, respectively, by the specified Zoom Factor (Default = 0.9, Valid Range = [0,1.0]).
- The Lighting options allow the user to control the lighting Balance (Directional vs. Ambient), as well as the light source’s Azimuth and Inclination (in degrees).
- By default, the lighting is 50% balanced (0.5), but this value can be changed via the Balance input field or the “<Directional…Ambient>” slider to be more directional (i.e. <0.5) or more ambient (i.e. >0.5).
- By default, the light source azimuth and inclination are both set to 0 degrees, but these values can be independently increased/decreased in the range [0,360] to set the orientation of the light source.
- Clicking the Reset button will reset all Camera/Lighting inputs to their defaults.
Cutting Planes
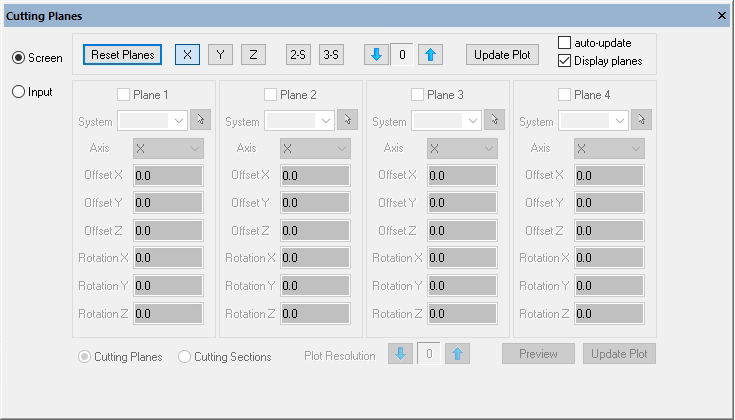
Display > Cutting Planes provides the ability to introduce a cutting plane into any model that contains a 3D solid geometric object, a 3D solid mesh or a 3D deformed shape/fringe contour plot (Figure 6). A complete description is given in the Cutting Planes Overview.
Model Summary
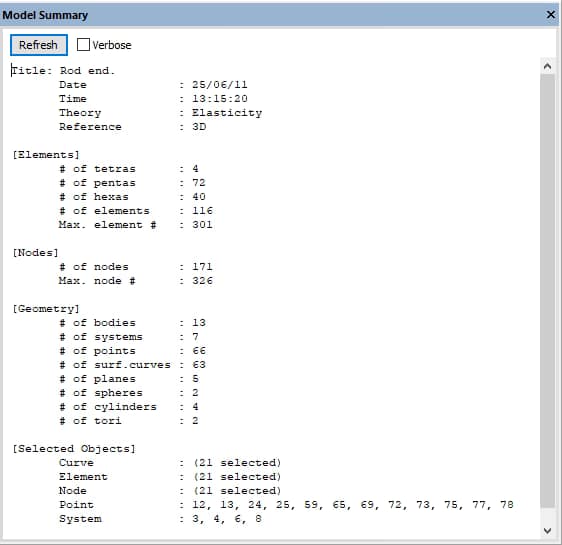
Display > Model Summary allows you to obtain a summary of model information such as the number of elements and number of nodes (Figure 7). In addition, currently selected objects (if any) are summarized by type at the bottom of the Model Summary pane.
Material Summary
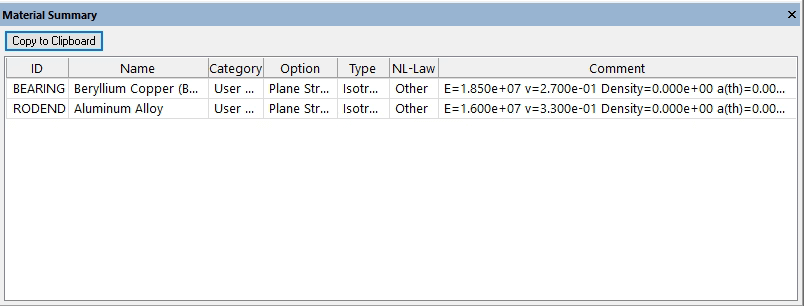
Display > Material Summary allows you to obtain a summary list of standard materials currently used in the model (Figure 8). Clicking the Copy to Clipboard button allows the user to copy the table to Excel or Notepad. In addition, right-clicking on a label column will display “Select Font” to allow font customizations.
The Material Summary carries useful information about the material including its ID, Name, type (isotropic, orthotropic, anisotropic) its nonlinear behavior law (Ramberg-Osgood, Elastoplastic, Bilinear, etc.), and material coefficients among others.
Material Database File Format
Information presented in this summary comes from a material database file provided with StressCheck. This material database can be updated at a customer site to include materials of particular interest to the user.
The format of the material database file (C:\Program Files\ESRD\StressCheck PE 12\UI\material.dat) is as follows:
Each material has four records.
Record 1: Name, Class, Type, Law, Units
- Name – up to 31 characters
- Class – up to 16 characters
- Type – one of the following
- (I)sotropic
- (O)rthotropic
- (A)nisotropic
- (T)ransversely-Isotropic
- (L)aplace
- Law – one of the following
- (N)one
- (E)lasto-Plastic
- (B)ilinear
- (5)Parameters
- (R)amberg-Osgood
- (H)yperelastic (Isotropic Exponential)
- (O)rthotropic-Exponential
- Units – one of the following
- (N)one
- (S)I
- (U)S
Record 2: Material properties. See Linear Elastic Materials and Elastic-Plastic Materials for the coefficients definition.
- For Isotropic: Modulus of elasticity (E), Poisson’s ratio (v), coefficient of thermal expansion (ath), specific weight, mass density
- For Orthotropic or Laminate Orthotropic: E11, E22, E33, v12, v23, v31, G12, G23, G31, a11, a22, a33, density, thickness
- For Transversely-Isotropic: E11, E22, G12, v12, v23, a11, density
- For Anisotropic: Not supported
- For Laplace: Kxx, Kxy, Kyy, Kxz, Kyz, Kzz, Q
Record 3: Six nonlinear coefficients: v, E1, E2, A1, A2, A3. Where v is the Poisson’s ratio, E1 is the modulus of elasticity and the other coefficients depend on the stress-strain law:
- Elastic-Plastic: E2=0, A1=Yield strength, A2=A3=0
- Bilinear: E2=Tangent modulus, A1=Yield strength, A2=A3=0
- 5-Param: E2=Tangent modulus, A1= Yield strength, A2 and A3 are the strain and stress values at the beginning of the strain-hardening.
- Ramberg-Osgood: E2=0, A1=S70E, A2=n, A3=0
Record 4: Comment.
Example for an Isotropic material:
2014-T6 Extrusion, ALUMINUM, ISOTROPIC, Ramberg-Osgood, US <-Record 1
0.109e8, 0.397, 0.128e-4, 0.101. 0.262e-3 <- Record 2
0.397, 0.109e8, 0.53e5, 18.5, 0.0, 0.0 <- Record 3
Syield=58 ksi, S-UTS=66 ksi, E-UTS=13%, Kic=30 ksi in^.5 <- Record 4
Material Property Units
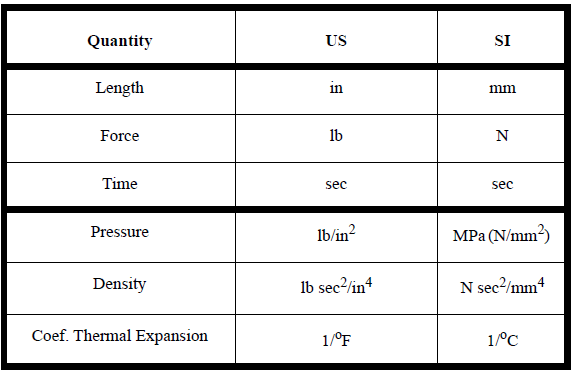
The material properties provided in the material database are given in the units indicated in the table below:

Assign Colors
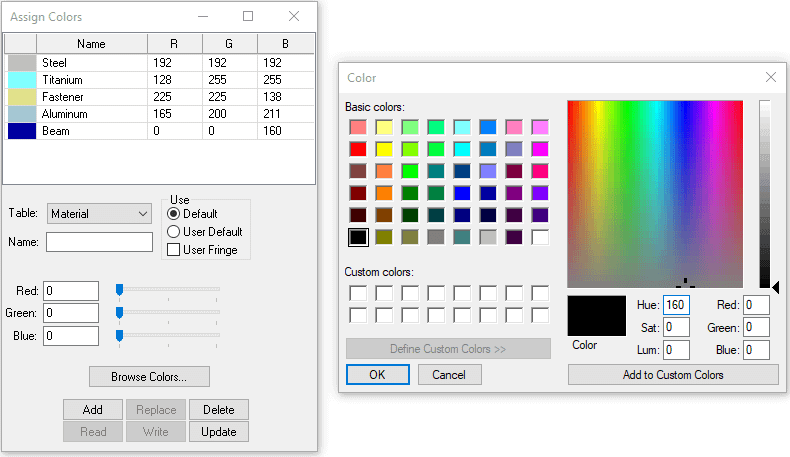
Display > Assign Colors provides options for displaying in grayscale, default colors, or a user defined color scheme. This menu can be used to change the color assignment for any model display in the user interface (Figure 9).
Color Tables
The StressCheck color tables are described in the below:
- The Default color table is a set of colors for each object type displayed in StressCheck, and is considered the “session” color table. This means that by default, these colors will be used for all models that you may load into StressCheck during the current session. This color table is initialized from a color definition file (.def) that is part of your user preferences; for a standard installation this is located in: %USERPROFILE%\AppData\Roaming\ESRD\StressCheck\V12.
- The Default color table is of fixed size (23 colors), but you are free to change the entries in the default color table if you wish. These new settings will be in effect for the remainder of your current StressCheck session.
- You may preserve these settings for future use (as a custom User Default color table) by writing them to a color definition file (“Write” button). If referenced in the preference file, this color table will automatically be used at the start of each StressCheck session.
- The Material color table is created for each StressCheck model, and is preserved with the input data as part of the StressCheck project file (.scp). You may create new entries in the Material color table, and then reference these color entries by name in the Input > Material tab > Assign subtab dialog.
- The User Default color table is similar to the Default color table, except that it is preserved in the StressCheck project file for the current model. Each model may have its own User Default color table which may be activated from the Display > Assign Colors interface as a substitute for the standard Default color table.
- The current User Default color table may be replaced by clicking the “Read” button and selecting a color definition file based on the Default color table size (23 colors) and associated color names.
- The User Fringe color table is provided so that you may override the internally generated fringe color table that StressCheck uses to display contour plots.
- If you define your own User Fringe color table, and make it active, the number of entries in the table will automatically control the number of fringe intervals used during contour generation.
- The Laminate color table is a set of colors for displaying the ply angles of laminated composites. The table is of fixed size (13 colors), but you can change the entries if you wish. The new settings will be in effect for the remainder of the current StressCheck session.
Editing Color Tables
To change a color table, select the desired table from the combo box in the upper left of the Assign Colors interface. The entries in the table will be displayed in the scrolling list at the top of the interface.
- To change an entry in the currently selected color table, select the entry name from the scrolling list. The color name and Red/Green/Blue values will feed back into the interface. You may directly edit these values, or click the “Browse Colors…” button to set them by choosing from a color palette. To save the new color settings, click Replace.
- For example, to change the color of solid objects, change the Table combo-box to Default, scroll down to select “Solid” from the list, modify its Red, Green and Blue values, then click the Replace button.
- To add a new entry to the Material or User Fringe color table, click Add.
- To save the current Default or User Default color table to a file, click Write and supply a file name (.def) where the color table will be saved.
- The Default colors in StressCheck can be overridden for each Microsoft Windows user by saving a color.def file in the same directory as the user preferences file.
- To read a saved color table back into the Assign Colors interface (User Default table only), click Read and browse to the saved file (.def). This saved color table will replace the current User Default table.
Use Options
The “Use” box at the right of the interface controls which color table is currently active. You may choose either Default or User Default as the current table controlling object colors. You may choose whether the internally generated color table is used for fringes (User Fringe not checked), or you may activate the User Fringe table by checking the box.
 Serving the Numerical Simulation community since 1989


