Tip: Start typing in the input box for immediate search results.Can't find what you're looking for? Submit a support request here.
Plot Solution Overview
Plotting Solutions in StressCheck
The data of interest can be computed and displayed for each solution (or animated sequence of solutions) on all elements, one or more elements, one or more element faces, or elements associated with a surface. Additionally, the data of interest may be rendered at the intersection of one or more cutting planes. The data of interest may be a standard engineering function, a formula name or a calculator expression.
To perform plot extractions for a solved StressCheck model, select the Plot tab in the Results dialog and specify the desired Plot extraction options (Figure 1):
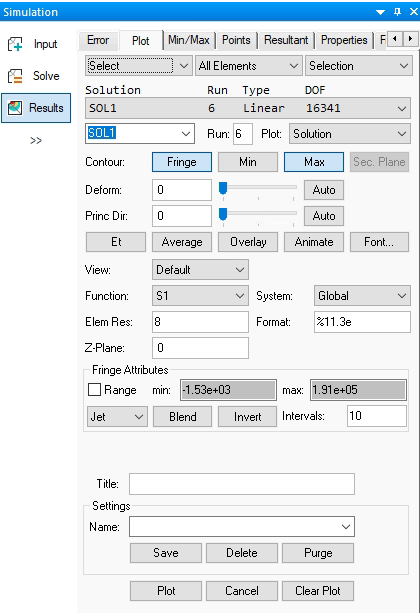
After specifying the plot options, click on Plot to perform the plot extraction. After the plot is completed, the Model View will update to display the plot extraction results. For more details, refer to StressCheck Tutorial: Plot Overview.
Specification of Solution ID(s) and Run(s)
To plot solutions for a solved StressCheck model, select the Plot tab in the Results dialog, set the Object and Method combo-boxes of the C/A/O/M to the desired configuration, select a Solution ID from the Solution combo-box and specify a Run number in the “Run:” field to plot. By default, the “Plot:” combo-box is set to “Solution”.
Note: if it is desired to plot a formula instead of a solution, change the “Plot:” combo-box from “Solution” to “Formula”.
Specification of Object Type
Decide whether the plot is to be performed on all elements (set the Object combo-box of the C/A/O/M to “All Elements”, the default), for individual elements (set the Object combo-box of the C/A/O/M to “Any Element”), for element faces (set the Object combo-box of the C/A/O/M to “Face” or “Face Surface”), or for surfaces associated with element faces (set the Object combo-box of the C/A/O/M to to “Any Surface”).
Selecting Objects for Plotting Solutions
If the Object combo-box is not set to “All Elements”, then in the Model View simply left-click on the objects on which the function will be plotted.
- If the plot is on a group of elements, for example, then left-lick and drag the cursor to enclose the desired group of elements in a marquee selection. The selected elements will be highlighted and ready for plotting. Note: it is important to disable the Wetted Faces toggle
if internal elements are to be included in the marquee selection.
- If you wish to add one or more elements to the selected group, hold the Shift key down and left-click on the elements to be added to the group.
- If you wish to remove one or more elements from the selected group, hold the Ctrl key down and left-click on the elements to be removed from the group.
- If you wish to cancel the current selection of objects, simply right-click on the Model View.
For example, to plot fringe contours on selected element faces change the Object combo-box to “Face” or “Face Surface” and select the element face(s):
For an example of plotting fringes for a selected group of elements, refer to StressCheck Tutorial: Plot using Any Element.
Specification of Fringe Contour and Markers
Determine if the Contour: “Fringe” button should be enabled or disabled. If “Fringe” is enabled, contours will be drawn for the selected standard function, formula name or calculator expression (Figure 2). Optionally, determine if markers should be drawn at the minimum function value (“Min” button), maximum function value (“Max” button) or both.
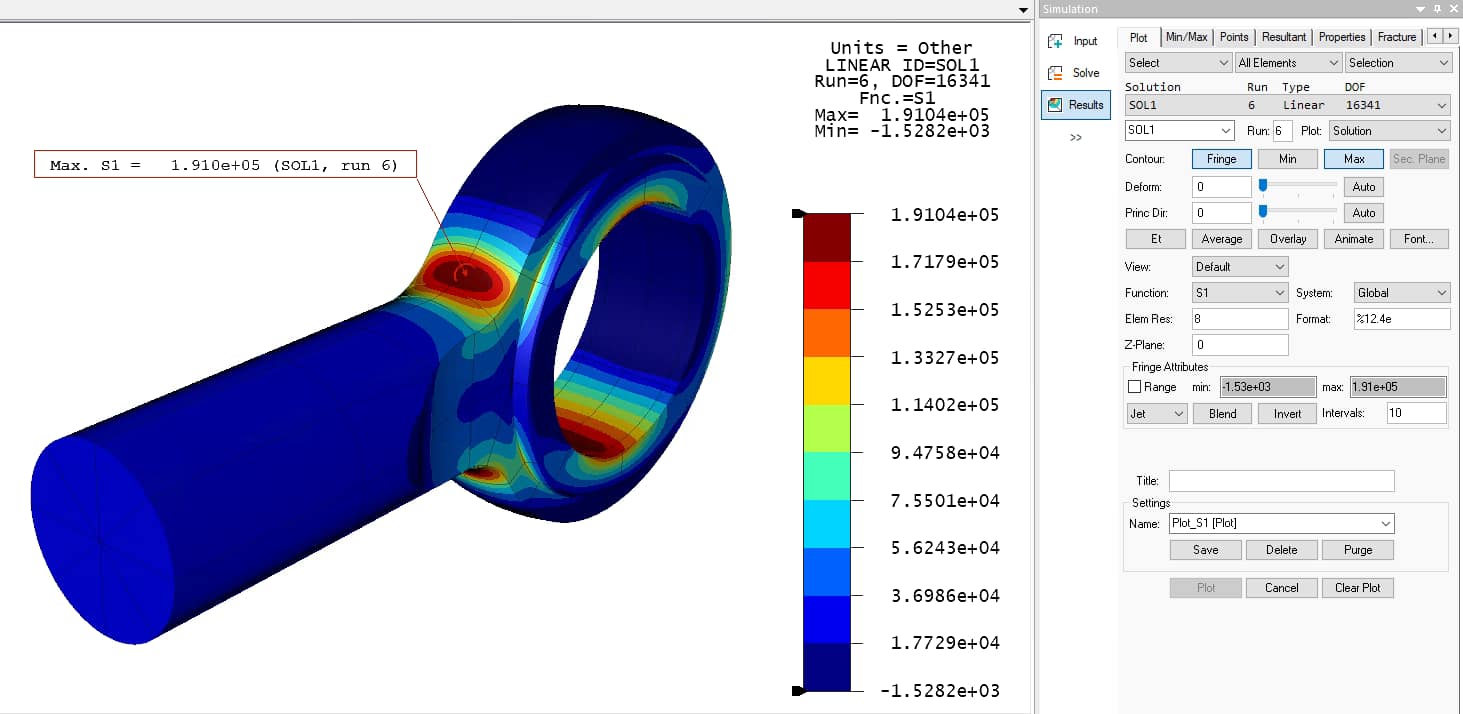
Fringe Attributes Pane and Plot Legend Options
If the Contour: “Fringe” button is enabled, under the “Fringe attributes” pane the user has the option to specify the minimum/maximum fringe values (enable “Range:” box, enter “min” and “max” values), specify the color map for the plot legend, increase/decrease the number of intervals (“Intervals:” field), and enable/disable fringe contour display options (“Blend”, “Gray”, and “Invert” buttons).
By default, fringe contours are automatically ranged at 10 intervals, minimum/maximum fringe values are automatically computed by the program (and marked on the plot legend via black slider arrows), and the plot legend will be displayed using the “Classic” color map (Figure 3):

Other color map options for the plot legend include “Turbo”, “Jet”, “Jet Alt”, “Plasma”, “Viridis” and “Gray” (Figure 4), as well as “Desert”, Hot” and “RedBlue”:

The minimum/maximum fringe values on the plot legend may be manually adjusted by left-clicking and dragging the slider arrows up or down, or by right-clicking near a slider arrow and entering a new minimum/maximum fringe value in the field that appears. For example, right-clicking near the maximum fringe value on the plot legend will display the following (Figure 5):
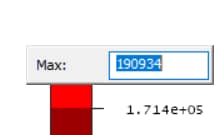
Then, the user may enter a new maximum value and hit Enter to update the plot legend/Model View.
Note: if a fringe contour plot is already displayed in the Model View, a convenient list of fringe attribute options can be made available by right-clicking in the plot legend’s fringe attributes area (Figure 6):
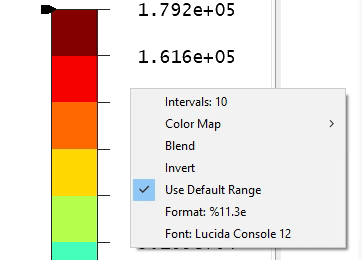
Learn more about the right-click context menu options available for fringe attributes in the Context Menu Overview.
Min/Max Markers
The possibility to include Min and Max extraction markers is available within the Plot function. A marker and label will be created at the location of the minimum and/or maximum value of the selected function, by turning on the “Min” and/or “Max” buttons next to the “Fringe” button.
- If “Max” is enabled, the label will be drawn in a red outlined box and a red marker will be drawn to the maximum function location.
- If “Min” is enabled, the label will be drawn in a blue outlined box and a blue marker will be drawn to the minimum function location.
The label text will identify if it is a minimum or maximum, include the extraction function name and value (if a formula is selected, the formula name will be used), the Solution ID and the selected Run number:
If the “Deform” input is non-zero the markers and label will be placed in the deformed configuration with the location for the max and min being updated with the “Deform” scale value. Labels may be moved from their current location by holding down the left mouse button over the label box and dragging it to a new location.
Note: if a plot is already displayed in the Model View, Min or Max extraction markers may be displayed by right-clicking in the plot legend’s header area and selecting “Min” or “Max” (Figure 7):
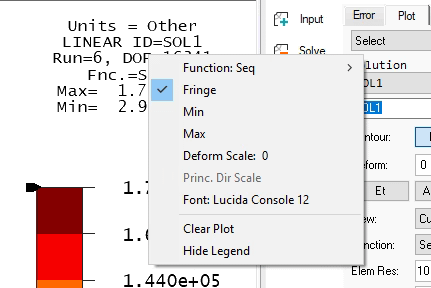
Learn more about the right-click context menu options available for the legend header in the Context Menu Overview.
Specification of Plot Scaling
Determine if the plot extraction should be displayed in a scaled deformed configuration (“Deform:”), or if the plot extraction should be displayed with principal direction arrows in the undeformed configuration (“Princ Dir:”). Figure 8 demonstrates the appearance of these options. Note: the “Princ Dir:” plot scale option will only be available if a principal stress or strain function (e.g., S1, E1) is selected.

By default, plot extractions will be displayed in the undeformed configuration (“Deform: 0”) and without the display of double-headed principal direction arrows (“Princ Dir: 0”). Enabling the “Auto” toggle next to a plot scale option will automatically adjust the plot scale to an automatically computed value based on the selected solution run and update the Model View. Note: for linear solutions principal direction arrows must be drawn in the undeformed configuration, if “Princ Dir:” is > 0 then “Deform:” will be automatically set to 0. For general (geometric) nonlinear solutions, the principal direction arrows must be drawn in the 1:1 deformed configuration, if “Princ Dir:” is > 0 then “Deform:” will be automatically set to 1.
To manually set the plot scale, enter the desired value in the associated field and hit the Tab key, or drag the associated blue slider arrow left or right until the desired value is reached. The Model View will then be automatically updated with the new plot scale value.
Note: if a plot is already displayed in the Model View, new plot scale values can be entered by right-clicking in the plot legend’s header area, clicking “Deform Scale:” or “Princ. Dir Scale” (if available), entering a new plot scale value, and hitting Enter (Figure 9):

Learn more about the right-click context menu options available for the legend header in the Context Menu Overview.
Unplotted Transparency (Any Element/Face/Face Surface Only)
When the Object combo-box is set to Any Element, Face, or Face Surface, the Unplotted Transparency option becomes available. Enabling this option and clicking Plot will render unplotted mesh regions semi-transparently (default: 80% transparency), while selected element faces will display fringe contours (Figure 10).
If the Deformed Configuration is enabled, both fringe and transparent elements will be rendered using the same deformation scale.


Specification of Et/Em
The Et/Em switch can be toggled when extracting min/max strains to indicate whether total (Et, default) or mechanical (Em) strains should be computed.
Specification of Elemental Average, Overlay and Animation
Determine if the contours will be averaged across element boundaries (“Average” button enabled), or plotted independently. By default, the “Average” button is disabled. You may also determine if a mesh overlay will be drawn to indicate the undeformed shape of the model mesh (“Overlay” button).
When enabled, the “Animate” button allows users to animate the deformed shape and fringe contours (discussed in the below Animation section).
Specification of View Orientation
If desired, set the “View:” combo box to the desired model view: Current, Default, or a user-defined model view (as described in the “Save View” section of the Views Toolbar Overview).
- Current: the plot will be performed in the current view orientation.
- Default: the plot will be performed in the default saved view orientation.
- User-defined: the plot will be performed in the user-defined view orientation.
Specification of Plot Function and Element Resolution (Elem Res)
Select a standard engineering function (e.g. Sx, Ey), or the formula (“Fmla”) or calculator (“Calc”) options, and specify the element plot resolution (formerly “Midsides:”, now labeled “Elem Res:”). The “Elem Res:” field allows the user to increase/decrease the number of interior grid points (midsides) used in the data extraction mesh. By default, this value is set to “8” and has a range [0, 20]. Note that the “Elem Res” field is synchronized with the “Element Resolution” field in the Display Controls dialog; setting one will automatically update the other to the same value. For more information on element resolution/midsides, refer to What Is the Midsides Input, and What Does It Control? and What Can Affect Fringe Plot Rendering Rates?
Note: if a plot is already displayed in the Model View, the plot extraction can be automatically updated with a new function by right-clicking in the plot legend’s header area and selecting the desired function from the “Function:” list (Figure 11):

Learn more about the right-click context menu options available for the legend header in the Context Menu Overview.
Specification of Local System
Optionally, select a local system as the reference for the plot (“System:” combo-box). By default, the “System:” combo-box is set to “Global”, but can be set to any local system (e.g. SYS1). Note: if a Cylindrical system is selected, the plot values will be in terms of R, T, Z instead of X, Y, Z. For example, Sx will be transformed to radial stress and Sy will be transformed to tangential stress.
For more information on plotting radial and hoop stresses/strains, refer to How Do I View Radial and Hoop Stresses/Strains?
Specification of Display Format
You may input the precision with which you wish to display data values (“Format:” field, in C standard format). The default format is in scientific notation and any C language format specification can be used. For example, the number Pi (3.141592654…) will be displayed as: 3.141592654e+00 in format %16.9e or 3.14 in format %5.2f. For more details on setting the display format, refer to the Display Format section in the File Menu & Main Toolbar Overview.
Note: if a fringe contour plot is already displayed in the Model View, a new display format can be entered by right-clicking in the plot legend’s fringe attributes area, clicking the “Format:” option, entering a new format in C standard format, and hitting Enter (Figure 12):

Learn more about the right-click context menu options available for fringe attributes in the Context Menu Overview.
Specification of Z-Plane
Enter a distance if you wish to perform extraction on any plane parallel to the XY-plane (“Z-plane:” field). This feature is very useful for visualizing “slices” of plotted data along the global Z-axis.
Plotting the Solution Data
Finally, click on the Plot button to plot the solution. The Model View should update to show the deformed shape and/or contour plot on the desired object(s), with respect to the specified plot function and plot options. Additionally, a plot legend with right-click context menu options will appear in the upper right corner of the Model View to indicate the Solution ID, Run number, DOF, plot shape (e.g., Deformed), plot function (e.g., Sx), and plot function min/max values. If “Fringe: Contour” was enabled, the legend will include the fringe attributes, also with right-click context menu options and using the selected color map:
To cancel a solution plotting operation, hit the Esc key. For an example of plotting fringes to assess a 2D stress concentration in an offset hole, refer to StressCheck Demo: 2D Stress Concentration Factor for Offset Hole.
Note: with the release of StressCheck v12.0, the Plot button will initially be disabled by the program after a successful plot extraction, and will remain disabled until the program requires a re-extraction of results data. When a re-extraction of results data is required, the Plot button will again be enabled and the label text associated with the cause of the re-extraction will turn red. For example, if a new function is to be plotted, the Plot button will be enabled and the “Function:” label text will turn red once the user selects the new function. Clicking the Plot button at this point will again disable the Plot button and change the “Function:” label text back to black.
Clearing Plotted Solution Data & Resetting the Display
To simply clear the previous plot’s deformed shape, fringes and/or markers from the Model View, click the Clear Plot button in the bottom-right of the Plot tab.
To clear plotted data AND re-draw the model objects and attributes, click Display > Reset or click the Display Reset button on the Edit Toolbar. The model in the Model View should now appear in the undeformed configuration and without fringes:
Plotting Tools & Best Practices
Deform Shape Plotting
It is good practice to plot the deformed shape first. Possible misrepresentations or errors in the boundary conditions can be quickly identified from the deformed shape. To perform a deformed shape plot, first indicate the Solution ID and Run number, and ensure the Object combo box in the C/A/O/M is set to “All Elements”. Then, after clicking on the Plot button, enable the “Auto” toggle next to “Deform:”. The deformed shape will then appear, along with the current deformed shape plot scale (Figure 13).

If you wish to compare the deformed shape with the undeformed shape, then turn on the “Overlay” option. You can enlarge the deformation by dragging the “Deform:” slider to the right or reduce the deformation by dragging the “Deform:” slider to the left. An example is shown below:
Contour (Fringe) Plotting
To perform a contour (fringe) plot, first indicate the Solution ID and Run number. This is accomplished by clicking on the appropriate line in the combo listbox directly under the C/A/O/M. Then, enable the Contour: “Fringe” button. If desired, set the “Deform:” or “Princ Dir:” (if applicable) plot scales to show the deformed shape or principal direction arrows, respectively. Select the desired function from the “Function:” list and indicate the element plot resolution in the “Elem Res:” field.
- For plotting purposes, each element is subdivided into a data extraction mesh which depends on the value of “Elem Res”, that is, the number of grid points along each side not including the end points (midsides). The desired data are then computed in the grid points of the data mesh.
- The higher the element resolution/midsides, the more accurate the display, and the longer the required computer time. In general, using an element resolution/midsides of 5 to 10 is sufficient.
Click on the Plot button, and the fringes of the selected function will appear in the Model View. Increasing the value of “Elem Res:” (“Midsides:” in pre-v12.0 releases) results in a higher resolution fringe:
A Note on Fringe Ranges and Intervals
It is recommended to not specify a range for your first plot; StressCheck will automatically set the range from the minimum to the maximum value of the function. The range of values of the plotted function will also be displayed. At this point, you may wish to select a Range and contour Intervals. For example, for the case shown below where the 1st principal stress (S1) values vary between -1.53e+03 and 1.91e+05 on a data mesh corresponding to an element resolution/midsides of 10, it is better to set the range from zero to 2e5 and select 8 intervals. The values will then be shown at 2.5e4-unit increments.
To change the range values, turn on the switch in front of “Range:” and enter the new values for the min and/or max range (Figure 14). Alternatively, you may also right-click on the max or min slider arrows in the plot legend’s fringe attributes and enter the new range value, or left-click and drag a slider arrow to manually adjust the range value.

The number of contour intervals is entered in the combo box below the max range value. Alternatively, the intervals can be updated by right-clicking in the plot legend’s fringe attributes area and entering a new integer value after clicking on the “Interval” option (Figure 15).

You can display the function either in colors or in gray scale (“Gray” button). The “Blend” button will blend adjacent colors. The “Invert” button will assign colors to the display function in the opposite order. To plot a standard function, for example S1 which stands for “1st principal stress”, select S1 from the “Functions:” combo-box. Specify the element resolution/midsides for the data mesh, and then click on the Plot button. The fringes will be recomputed based on the new range/intervals:
A Note on Fringe Continuity
As described above, the desired data are evaluated at the grid points of the data mesh separately for each element. Therefore, two sets of values are produced at interelement boundaries, one from each element. Any discontinuity in contour fringes will be clearly visible. Any discrepancy is an indication of error in the plotted data. Generally the highest stress values are of interest and therefore attention should be focussed on the corresponding contour values. Contours corresponding to low stress values can “jump” across interelement boundaries considerably and should not be a cause for concern. In the equivalent stress contour fringes shown below, the continuity of contour fringes is a confirmation of the quality of the solution and the data computed from the solution. If you wish to produce a plot with no jumps, turn on the Average option:
For more information on fringe contour quality checks, refer to What Are the Key Quality Checks for FEA Solution Verification?
Displaying and Plotting Formulae
To visualize a user-defined formula, you may change the “Plot:” combo-box from “Solution” to “Formula”, select the formula name from the “Formula:” combo-box, and then click Plot.
For an example of plotting formulae fringes, refer to StressCheck Tutorial: Plotting Formulae Fringes.
Z-Shape Function Plots (Planar Only)
An alternative way to display information as a “raised-relief map” is the Z-shape function. To produce such a display, proceed as follows: enable the “Z-Shape” toggle, select the function of interest, specify the element resolution/midsides, and then click on the Plot button. To obtain a perspective view, select the Rotate icon from the Views Toolbar and rotate the figure until a satisfactory view appears.
To scale the displayed function, click and drag the slider arrow next to “Deform:” to the left or right, or enter a new plot scale value in the “Deform:” field and hit Tab. Note: the Z-shape function is applicable for the Planar reference only.
Animation Plots
The Plot tab provides a facility (“Animate” button) for animating the deformed shape of a model or a solution sequence (“Multi Sol” checkbox). The solution sequence may be a sequence of linear solutions for which you wish to animate the convergence of a particular engineering function. The sequence may be a parametric solution from a design study for which you wish to animate an engineering function as it changes due to the change of a design variable. The sequence may also be a series of load steps from a nonlinear analysis for which you wish to monitor the shape or engineering function as the nonlinear solution converges.
The Animation options (Figure 16) are activated from the Plot tab when you enable the “Animate” button. Prior to activating the animation, you should determine whether you wish to animate a single solution or a sequence of solutions, and choose the number of steps in the animation sequence.

- If you are simply animating a deformed shape, the number of steps will be used to divide the maximum range of the deformation scale into equal increments so that the first step of the animation will have the minimum deformation (zero), and the final step will have the maximum deformation.
- If you are animating a deformed shape with fringe contours, the number of steps will be used to divide the maximum range of the fringe scale into equal increments so that the first step of the animation will have the minimum fringe value, and the final step will have the maximum fringe value.
- If you are animating a solution sequence by enabling the “Multi Sol” checkbox, the Run number supplied in the “Run:” field of the Plot tab will be the first solution in the sequence. After each image is generated, the run number will be incremented to identify the next solution in the sequence until the step limit is reached. For this reason, the run number and number of steps should be chosen carefully to correspond to the proper range of run numbers to be animated.
Animation will begin when you click the Plot button in the Plot tab:
While the animation is active, it is possible to enable or disable the undeformed shape overlay, the geometric and mesh objects, the boundary conditions, etc., by just clicking the corresponding buttons or toolbar icons. During the animation, it is also possible to change the view of the model (rotating, zooming, etc). You can control the speed of the animation by increasing/decreasing the speed control in the animation interface. The speed value is a “repeat” value; it will control how many times the current image is repeated before advancing to the next image. This has the effect of slowing down the animation as you increase the speed value, and speeding up the animation as you decrease the speed value. You can also pause the animation and then step backward or forward one image at a time, by first clicking the Pause button and then clicking the backward/forward arrows. To leave Pause mode, click the Pause button again.
When you wish to stop the animation, you may either disable the “Animate” button, press the escape (Esc) key while the Model View has focus, or click the Stop button in the Animation toolbar.
Graphic Capture & Recording Animation
While the animation is progressing, you may capture the animation sequence as a series of images, then play them back in rapid succession. This is useful if the model is very complex, and the dynamic animation proceeds too slowly. Click the Record button to start capturing the sequence of images. Once the sequence is captured, you may click the Stop button, and then click Play to playback the recorded images. You may need to control the speed if the playback is too fast. Of course, you cannot change the view or content of the Model View during playback. You must first stop the playback by clicking Stop or Play. The playback may also be paused and single stepped as described above.
If you wish to record a new sequence, just click Record again. Image frames captured during the “record” operation may be saved to JPEG files automatically during the animated display sequence. Each time the “record” button is depressed, the program will ask whether the animation frames should be saved. If yes, the program will automatically save each frame to a .jpeg file named the same as the current database but with a suffix identifying the frame. The quality (amount of compression) of the .jpeg files can be controlled in the File > Options interface. To remove the animation options from view, disable the “Animate” button in the Plot tab.
For an example of animating a sequence of results, refer to StressCheck Tutorial: Animate a Sequence of Results.
Cutting Plane Plots
It is possible to plot the deformed shape and/or fringe contours at arbitrarily located/oriented cutting planes. To open the Cutting Planes interface, click on the Cutting Plane button located in the Display options toolbar. The Cutting Planes dialog provides the ability to introduce a cutting plane into any model that contains a 3D solid geometric object.
For models that contain a finite element mesh, a surface representing the intersection between the cutting plane and the solid will be constructed. If a fringe (contour) plot is created, a fringe plot will be displayed on the cutting plane surfaces. The resolution of the results may be increased or decreased by pressing the up/down arrows and the resulting plot can be updated automatically by selecting the “auto-update” checkbox or manually pressing “Update Plot”. Note that changing the fringe plot function and pressing “Plot” within the Plot tab will also update the cutting plane plot. Below is an example of a cutting plane extraction of stress contours:
The “Preview” button is used to preview the cutting plane configuration in the Model View while the “Update Plot” button is used to set or update a Contour Plot along the intersection of the Cutting Planes. Note: the Plot Resolution does not correspond to element resolution/midsides in the cutting plane tool. It is highly recommended the user slowly increment the plotting resolution if the initial results are not satisfactory. Values greater than 4 for the resolution can result in significant plotting times. Pressing “Esc” will cancel the plotting operation.
Close the Cutting Planes dialog to clear all cutting plane surfaces. For more information, refer to Cutting Planes Overview.
 Serving the Numerical Simulation community since 1989
